💸 GBTA just made the gap official: spend +7.2%, trips +1.3%. Read that again.
Business travel just crossed $1.71T. Trips barely grew. Your 2027 budget is already wrong.
This week
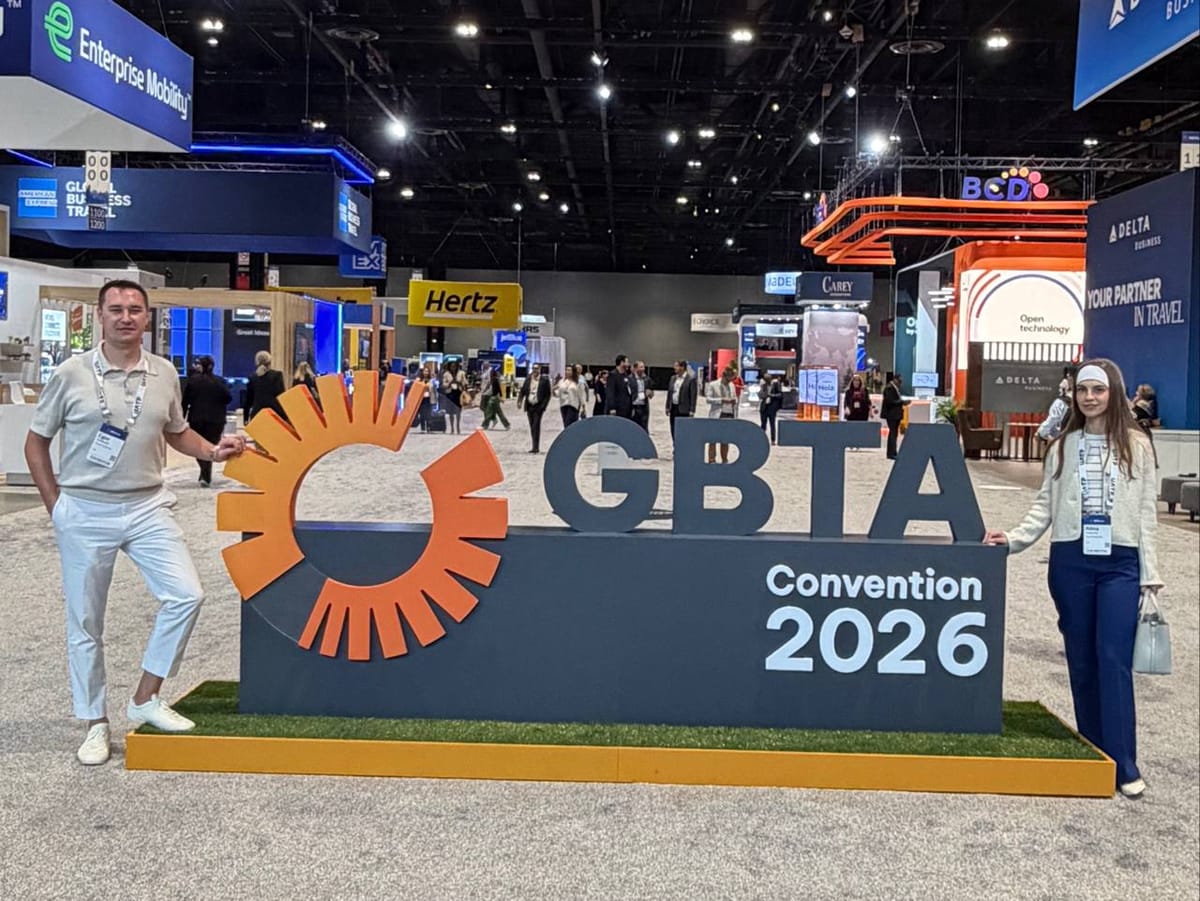
GBTA published its 2026 Global Business Travel Index at the Chicago convention this month, and one pair of numbers stopped every finance leader in the room:
Global business travel spend: $1.71 trillion. +7.2% YoY. Global business trips: 1.84 billion. +1.3% YoY.
Read that again. Spend is growing more than five times faster than volume. Every trip your company books next year will cost measurably more than the same trip today — not because you're travelling more, but because each trip carries more cost inside it.
That's the number your CFO is going to hand back to you in Q4 budget planning. Better to be ready.
What the divergence actually means
Do the arithmetic. $1.71T divided by 1.84B trips is roughly $929 in spend per trip on average — up from $874 last year. That's a 6.3% jump in cost-per-trip in twelve months, on a base that was already at historic highs. Break out by region and the picture sharpens:
- Europe: spend +7.0% on volume +0.7%. European trips are getting the most expensive fastest. If your program bills to a European entity, your per-trip cost inflation is running roughly 6.3 points above trip growth — the widest gap in any mature market.
- North America: spend +6.9% on volume +1.8%. Cost per trip up ~5 points. US programs get a small volume tailwind; Canadian ones don't.
- Asia Pacific: spend +7.5% on volume +2.0%. Largest region ($692B), still growing fastest by absolute dollars.
- Latin America: spend +11.7% on volume +1.5%. Brazil alone: +13.8% in spend. Concentrated cost inflation, small base.
- Middle East: volume down 12.3% — the outlier. Spend down 5.5%. If your travelers route through the region, expect capacity to keep shrinking through 2027.
Why this is the single most important shift of 2026
Every travel program's 2026 budget was built on a "trips × cost per trip" assumption where cost per trip was the boring line. GBTA just made cost per trip the only line that matters. Three implications you should be walking into your next finance review with:
1. Trip count is no longer your budget lever. For a decade, travel managers pitched cost containment by pushing trip volume down. That story is finished. Global trip counts are flat and will stay flat — GBTA has volume growing 1.3% into 2027 and softening after that. If your CFO is still asking "how many trips did we cut?", you're being asked the wrong question. Reframe the conversation around cost per trip, mix, and payment terms.
2. Your expense workflow is now a P&L, not a back office. When cost per trip grows 6% a year, the difference between full auditing and 40% sample auditing is real money for the first time. Every un-itemised receipt, every out-of-policy booking, every duplicated per diem — they all cost more this year than last year. Programs still running expense as a paper-form-and-quarterly-audit process are the ones that will get squeezed hardest in 2027.
3. Payment terms just became a competitive advantage. With spend inflating faster than volume, working-capital tied up in travel is growing on autopilot — even if you book zero additional trips. Programs on 30-day corporate card cycles are effectively financing their vendors' price increases. The ones that renegotiated to 60-day terms this year are the ones with room in their P&L to absorb the shock.
What to do this week
- Recompute your cost-per-trip metric using last month's data and the same month last year. If the delta is under 5%, you're either running a very tight program or you're miscoding — check your data source.
- Pull one out-of-policy category and audit it end-to-end. Pick the most-expensed non-travel line (usually meals or ground). This is where 2026's cost inflation is hiding.
- Ask your card provider what your payment terms cost you in float. If the answer is "we haven't calculated that," you already know the answer.

Two tools built exactly for this moment
Full disclosure — we build these:
- Travel Code Expense Management → — Itemized OCR, real-time policy enforcement, GL sync. Full-population auditing at roughly the cost of 40% sampling. Built to make the "cost per trip is the only line that matters" reality operable.
- Travel Code Net-60 Card → — 60-day settlement at 0% interest, or shorter terms with up to 1.5% TC Cash back. The float that used to belong to your bank now sits on your P&L.
Launch offer — Scale plan, 100% off for 6 months. First companies to sign a contract lock in six months of the full integrated Scale plan (travel + expense + cards + AI agents) at zero cost. Ends August 31. If you've been waiting for the right moment to consolidate travel, expense, and card into one ledger, this is that moment. Reply to this email and we'll set up a 20-minute walkthrough.
The bottom line
The GBTA 2026 Index is not a routine industry update. It's the first time the data has said, in one chart, that the old lever (trip count) is dead and the new lever (cost per trip and cash cycle) is what your program will be judged on. The programs that pivot to the new lever in Q3 will look brilliant in Q1. The ones that don't will spend all of 2027 explaining why their budget request keeps growing.
Sources
GBTA — 2026 Global Business Travel Index (Convention 2026, Chicago) · GBTA — Global Business Traveler Survey, May 2026 (n=4,700) · GBTA — U.S. Economic Impact Study, $623.8B / 488M trips / 2.1% of GDP · GBTA — Top Global Cities Economic Impact Study (25 cities = $283B in revenue, 50% stays local)
Travel Code Insider is a weekly briefing for corporate travel leaders. Reply with what's working — or what isn't. travel-code.com · Expense Management · Net-60 Card